 Shareholder/Analyst Call Prepared Remarks Transcript")


")
The Global X Copper Miners ETF (NYSEARCA:COPX) is an exchange-traded fund from Global X that is designed to provide investors with an easy way to track the performance of the Solactive Global Copper Miners Total Return Index. We will discuss the composition of this index in just a moment, but in short, it tracks the common equity performance of companies that are involved in the mining of copper, which is one of the more commonly used metals in several industries.
Copper And The Economy
Copper is one of the most commonly used metals in construction, electronics, and manufacturing.
This metal is frequently used in copper piping, which used to be the most common type of plumbing in residential properties, although its usage has declined in favor of PVC and PEX piping in recent years. However, the metal is still commonly used in commercial and industrial buildings due to being more durable and resistant to heat than plastic-derived piping.
Copper is also widely used as a conductor in electrical grids, consumer electronics, automobiles, and other power transfer applications. While it is true that copper is not as good a conductor as silver, it is much more affordable and so lends itself well for use in many applications that do not require extremely high conductivity. For example, it is much more cost-effective for a utility to use copper wiring to distribute electricity over a wide geographic area than to incur the high expense of using silver wiring, given that silver’s higher conductivity would not provide a sufficient advantage to be worth the expense.
Copper is also an excellent conductor of heat, and so it is frequently used in cookware or in manufacturing applications where heat needs to be transferred from one place to another. Copper also has microbial properties, which give it some use in healthcare applications. For example, surfaces in a healthcare facility can be coated with copper plating, which results in some viruses and bacteria being killed on contact. This quality could be useful if there is a surface in a hospital that several different people regularly come into contact with.
Due to its widespread use in many different areas, the price of copper is frequently used as a measure of economic health. Accounting Insights published an article in February 2025 that referenced this quality. From that article:
Copper, often referred to as “Dr. Copper,” is renowned for its ability to predict economic trends due to its widespread applications in construction, electronics, and manufacturing. Its significance as a barometer for global economic health stems from its essential role in these industries.
The price of copper varies due to a variety of factors, but historically, there are a few things that have had significant impacts on its price. Here are a few of them:
- Copper frequently moves inversely to the U.S. dollar. For example, whenever the U.S. dollar weakens, copper prices rise and vice versa.
- China’s industrial production plays a significant role in copper prices due to the fact that the Chinese industry is one of the largest consumers of copper in the world. As such, strengthening the Chinese industry will apply upward pressure on copper prices. When Chinese industrial production is declining, or when China is in a recession, copper prices will tend to decline.
These are just a few of the factors that affect copper prices, as there are other reasons why traders and investors may purchase copper. For example, copper is sometimes used as collateral for margin loans, and a high demand for these loans could cause an increase in copper prices. For the most part, though, the state of the economy in China has been perhaps the biggest factor in determining copper prices in recent years.
Global X Copper Miners ETF Versus Copper Prices
It is important to understand the drivers of copper prices in order to understand how the Global X Copper Miners ETF will perform in a portfolio. This is because the revenue and profits of the companies whose equities comprise this fund are directly correlated to the price of copper. Their profits will rise and fall with copper prices, and as such, their equities will rise and fall with copper prices. As a result of this, we would expect the share price of COPX to exhibit a high correlation with the price of copper.
This is, in fact, the case. This chart shows the spot price of high-grade copper along with the share price of COPX over the three-year period that ended on September 11, 2025:
Barchart
In this chart, the spot price of high-grade copper is represented by the black line, whereas the blue line represents the share price of COPX. As we can see, the two assets exhibit a very high correlation, with the shares of this fund typically rising whenever copper prices rise and declining whenever copper prices fall. The only real exception to this came over the period of August 1, 2025, through mid-September 2025, in which the shares of this fund rose far faster than the price of copper. It is possible that this was driven by some factor other than the price of copper. For example, the Global X Gold Miners ETF (GDX) rose by 30.60% over the period from August 1, 2025, to September 11, 2025. Some of the companies that are held in COPX also produce gold, silver, and other precious metals, so it is possible that their strong performance during the August 1, 2025, to September 11, 2025, period actually benefited COPX as well.
For the most part, however, investors should generally expect the performance of COPX to correlate with the price of high-grade copper. Thus, it may make sense for an investor who expects the price of copper to rise to purchase this fund.
About The Solactive Global Copper Miners Total Return Index
The Global X Copper Miners ETF is an exchange-traded index fund that tracks the Solactive Global Copper Miners Total Return Index. According to the methodology document for this index, a company must have a few qualifications to be included in the index:
- Must have a business focus within the copper mining industry or closely related activities,
- The primary listing for its common equity is in a developed or emerging market that is not India, China, or Taiwan (although companies listed on the stock exchange in Hong Kong are eligible for inclusion in the index),
- The total value of all publicly traded common equity issued by the company exceeds US$200 million,
- At least 75,000 individual shares traded monthly and at least US$250,000 of daily trading volume,
- Must have at least ten days of trading history prior to the day that the index is rebalanced.
Most large mining corporations will meet the trading volume requirements, with the possible exception of some small mining companies that still have much of their common stock in private hands and not available for purchase by ordinary investors. The hardest requirement for most large mining companies to achieve is the first one, which requires that a significant proportion of their revenue come from copper mining or related activities. In fact, as of September 10, 2025, there are only 39 companies that meet all of the requirements above. Here are the 39 components of the index as of that date:
|
Company Name |
% of Index |
|
Zijin Mining Group Co. Ltd. (ZIHMF) |
5.58% |
|
Hudbay Minerals (HBM:CA) |
5.24% |
|
Lundin Mining Corp. (LUN:CA) |
5.06% |
|
First Quantum Minerals Ltd. (FM:CA) |
5.04% |
|
Sumitomo Metal Mining Co. Ltd. Ord. (OTCPK:STMNF) |
4.82% |
|
Antofagasta plc (OTC:ANFGF) |
4.79% |
|
Freeport-McMoran (FCX) |
4.47% |
|
Boliden AB (OTCPK:BLIDF) |
4.12% |
|
KGHM Polska Miedz SA (OTCPK:KGHPF) |
4.03% |
|
Teck Resources Limited Class B (TECK.B:CA) |
4.03% |
|
Southern Copper Corp. (SCCO) |
4.01% |
|
Capstone Copper Corp. (OTCPK:CSCCF) |
3.99% |
|
Glencore PLC (OTCPK:GLCNF) |
3.91% |
|
China Gold International Resources Corp. Ltd. (OTCPK:JINFF) |
3.90% |
|
BHP Group Ltd. (BHP) |
3.86% |
|
Sandfire Resources Ltd. (OTCPK:SFRRF) |
3.64% |
|
Ivanhoe Mines Ltd. (IVN:CA) |
3.40% |
|
Aurubis AG (OTCPK:AIAGF) |
3.39% |
|
Jiangxi Copper Co. Ltd.-H (OTCPK:JIAXF) |
3.25% |
|
Minmetals Resources Ltd. (OTC:MMLTF) |
2.64% |
|
Mitsubishi Materials Corp. (OTCPK:MIMTF) |
2.14% |
|
NGEx Minerals Ltd. (NGEX:CA) |
1.97% |
|
China Nonferrous Mining Corp. Ltd. |
1.85% |
|
Ero Copper Corp. (ERO:CA) |
1.51% |
|
Wanguo International Mining Group Ltd. |
1.05% |
|
Taseko Mines Ltd. (TKO:CA) |
1.02% |
|
Al Masane Al Kobra Mining Co. |
0.89% |
|
Mac Copper Limited (MTAL) |
0.82% |
|
Altius Minerals Corporation (ALS:CA) |
0.81% |
|
Atalaya Mining plc (OTCPK:ATLMF) |
0.73% |
|
Foran Mining Corporation (FOM:CA) |
0.71% |
|
Nittetsu Mining Co. Ltd. (OTCPK:NTTMF) |
0.61% |
|
Wai Resources Ltd. |
0.51% |
|
Solaris Resources Inc. (SLS:CA) |
0.46% |
|
Develop Global Ltd. (OTCPK:VTEXF) |
0.45% |
|
Northern Dynasty Minerals Ltd. (NDM:CA) |
0.43% |
|
Central Asia Metals plc (OTCPK:CAMLF) |
0.36% |
|
Solgold plc (SOLGGF) |
0.30% |
|
Luca Mining Corp. (LUCA:CA) |
0.23% |
One thing that we immediately notice is that the majority of the companies in the Solactive Copper Miners Total Return Index have their primary stock listing outside of the United States. This is not uncommon for a mining company, as many investors who are familiar with the mining sector already know. One reason is that some foreign countries are generally friendlier towards the mining industry than the United States. As the Canadian Foreign Policy Institute explains:
Internationally-focused mining companies set up shop in Canada because the financial and technological infrastructure is present and, in the words of author Alain Deneault, Canada is “the most attractive tax and regulatory haven for the world extractive industry.”
Disclosure requirements on the Toronto and Vancouver stock exchanges are relatively lax. Firms must only report operational information of interest to a “reasonable investor”. A publicly listed firm is not required to disclose operational developments causing social harm if they are unlikely to impact the company’s bottom line. The Mining Association of Canada boasted that TSX rules were “designed around the needs of the mining industry.”
In addition to this, there is the fact that many mining companies choose to put their primary listing on the exchanges of Canada, the United Kingdom, or Australia, and this creates something of a positive dynamic for mining companies. International investors who are specifically looking to invest in mining companies will be fairly active on the exchanges of those countries, and as such, mining company stocks experience greater liquidity in those countries than they would in a country that does not have a strong reputation for hosting mining companies on its exchanges.
Solactive states that it conducts a periodic rebalancing of the index, and that rebalancing is done with the following rules:
- No individual company can account for more than 4.75% of the index,
- The total weighting of all companies that do not fulfill the average volume criteria cannot exceed 10%.
We can see in the chart above that there are currently six companies in the index that have individual weightings of greater than 4.75%. This is something that can occasionally happen between rebalancing dates, should the stock performance of one company be stronger relative to the performance of the other companies in the index. Once the quarterly rebalancing takes place, these companies will have their weightings in the index reduced to bring them back under 4.75% of the total index.
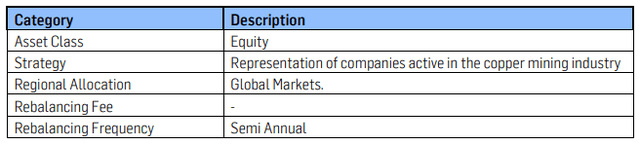
Solactive states in the methodology document for the index (linked above) that it conducts a semi-annual rebalancing of the index:
Solactive
Global X’s documentation for the Global X Copper Miners ETF says that the index rebalances semi-annually on the last trading day of April and October of each year.
Solactive’s website for the Solactive Global Miners Total Return Index shows that it does a quarterly continuous listing standards review every January and July in addition to the semi-annual rebalance. This is somewhat similar to the rebalance, in that Solactive may make changes to the index if necessary. However, its methodology whitepaper states that it only makes changes in certain circumstances, such as the largest component growing so much that it ends up exceeding 25% of the total index or the top five index components combined exceeding 60% of the index. This helps to correct a problem that can arise with market capitalization-weighted indices that are passively tracked by exchange-traded funds or open-ended index funds. Basically, whenever an investor purchases the shares of an index fund, more of the investor’s money is used to purchase the largest companies rather than being balanced, and as this ultimately puts more buying pressure on the largest companies, they end up accounting for a greater and greater proportion of the index. At the quarterly review, Solactive makes changes to this index if this actually occurs, but the index provider is not rebalancing everything to bring the weightings down to 4.75% of the index or lower.
About COPX
The Global X Copper Miners ETF was established on April 19, 2010, as an exchange-traded index fund that is intended to track the Solactive Global Copper Miners Total Return Index. There is another version of this fund that tracks the Solactive Global Copper Miners Total Return v2 Index that trades in the United Kingdom. It is important not to confuse them, as they both have the same ticker symbol, and both may come up when doing a search for the fund. For the purposes of this article, the fund being referenced is the Global X Copper Miners ETF that trades under the symbol COPX on the New York Stock Exchange.
COPX is a mid-sized exchange-traded fund with approximately $2.25 billion under management. This makes it substantially larger than some other exchange-traded index funds that invest in copper miners:
|
Fund Name |
Assets Under Management |
|
Global X Copper Miners ETF |
$2.25 billion |
|
Sprott Copper Miners ETF (COPP) |
$35.71 million |
|
Themes Copper Miners ETF (COPA) |
$967,000 |
|
iShares Copper and Metals Mining ETF (ICOP) |
$78.50 million |
As clearly shown, COPX is by far the largest exchange-traded index fund that invests in the copper mining industry. It is also the most liquid, with an average of 1.34 million shares changing hands every day. As such, it will likely be the first choice for anyone who wishes to invest in this particular sector, as it is relatively easy to get into and out of its shares without having a significant impact on the price, and as we saw earlier, its share price generally correlates pretty well with the price of copper.
The holdings of each of these funds are also different due to the fact that they track different indices. This is shown in this table:
|
Fund Name |
Index Tracked |
|
Global X Copper Miners ETF |
Solactive Global Copper Miners Total Return Index |
|
Sprott Copper Miners ETF |
Nasdaq Sprott Copper Miners Index |
|
Themes Copper Miners ETF |
BITA Global Copper Mining Select Index |
|
iShares Copper and Metals Mining ETF |
STOXX Global Copper and Metals Mining Index |
Each of these indices is constructed using a different methodology, so the holdings of any fund tracking them will also be somewhat different. We should also note that, unlike the other exchange-traded funds, the Sprott Copper Miners ETF also has an allocation to physical copper. All three of the other funds, including COPX, invest solely in common equities. As such, investors who wish to have exposure to the actual metal have no choice but to choose the Sprott Copper Miners ETF or purchase one of the other three exchange-traded funds along with something like the Sprott Physical Copper Trust (COP.UN:CA) that holds copper itself.
The usual strategy for an exchange-traded index fund is simply to purchase all of the components in its benchmark index with the same weightings as the index itself has. This is the basic strategy of COPX, and as such, we can assume that the largest positions in the fund will be pretty similar to the highest-weighted common stocks in the Solactive Global Copper Miners Total Return Index. This is indeed the case, which we can see here:
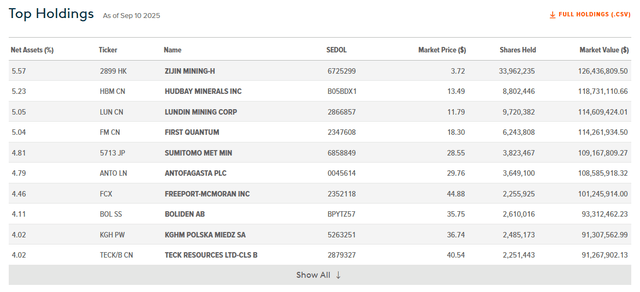
Global X
These are the largest positions in the fund as of September 10, 2025, which, as we can see, are very similar to the composition of the index that we saw earlier. However, the weightings of a few of the positions differ from the index by a few basis points at most. This is because COPX, unlike the index that it tracks, also includes a small amount of cash in its portfolio:
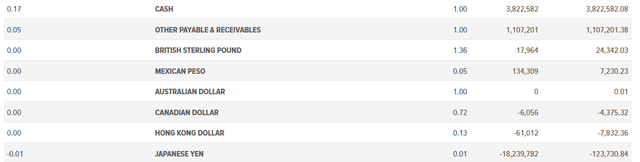
Global X
This is money that has been collected in dividends from the companies in the portfolio, primarily. The companies in the fund’s portfolio pay out dividends on a different schedule than the fund itself, so the fund holds this money in cash until its own distribution date. The fund pays a semi-annual distribution to its investors in January and July of each year, with the ex-distribution date typically being around the end of June and December. The Global X Copper Miners ETF has a distribution yield of 1.51%, although this will vary from time to time, depending on the profitability of the underlying companies and other factors. After all, many companies that are located outside of the United States have variable dividends that depend on the company’s profits. The profitability of copper miners depends heavily on the price of copper, so their dividends will be higher during periods of high copper prices. However, since the number of shares outstanding of the Global X Copper Miners ETF constantly varies due to the exchange-traded fund structure, it will not always be the case that the fund’s distribution will perfectly correlate with the dividends paid out by the underlying companies. After all, all of the dividends that the fund receives have to be shared with all of the shareholders of COPX, even if there are more shares outstanding at the time that the fund pays its distributions than there were at the time that the fund received the dividends from the company in the portfolio.
COPX has a lower distribution yield than some of its peers:
|
Fund Name |
Yield on September 10, 2025 |
|
Global X Copper Miners ETF |
1.51% |
|
Sprott Copper Miners ETF |
2.08% |
|
Themes Copper Miners ETF |
0.92% |
|
iShares Copper and Metals Mining ETF |
2.15% |
With the notable exception of the Themes Copper Miners ETF, COPX has the lowest yield shown. This may or may not be a problem, though, depending on one’s own investment goals.
Over the ten-year period that ended on September 11, 2025, COPX delivered price appreciation of 245.27%. This was marginally better than the 234.08% gain of the S&P 500 Index (SP500) over the same period:
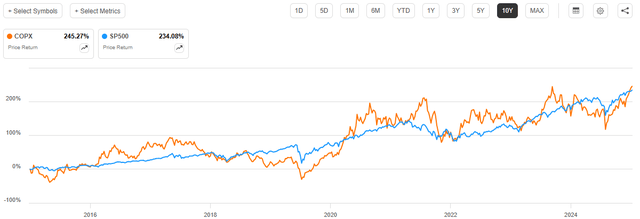
Seeking Alpha
The fund has a higher yield than the S&P 500 Index, so if we were to assume that investors reinvested all distributions paid out by the Global X Copper Miners ETF, they would have received a greater total return than an investor who purchased an S&P 500 Index fund and reinvested all the distributions paid out by that asset:
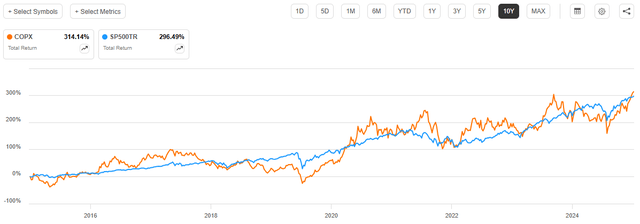
Seeking Alpha
None of the other three copper mining exchange-traded funds has a long enough history to see how they would have done over the same ten-year period. In fact, the Themes Copper Miners ETF does not even have a one-year history as of September 10, 2025. However, the other two do, so we can compare them to COPX to see how they performed over the one-year period that ended on September 10, 2025:
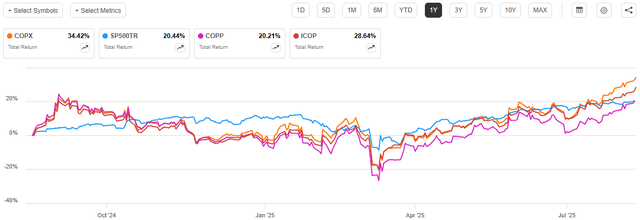
Seeking Alpha
As we can see, on a total return basis, COPX outperformed both of the other two funds over the period in question. Thus, the comparatively lower yield has not actually hindered its performance. Depending on a given individual’s goals, it might be acceptable to receive a lower distribution yield in exchange for a higher total return.
Key Risks To Consider Before Investing
As is the case with all investments, there are some risks that investors should consider before purchasing shares of COPX. Perhaps the most significant here is the fund’s share price correlation to copper prices. It is possible for copper prices to decline, and in fact, it is typical for them to decline during economic slowdowns or recessions. This is one of the reasons why investors frequently use it as a barometer for economic health, as declines in copper prices typically occur when manufacturing activities start to slow down.
As was mentioned earlier, an economic slowdown need not occur in the United States in order to push copper prices down. China is by far the largest consumer of copper in the world. According to the World Copper Council, Asia accounts for 74% of the world’s copper consumption:
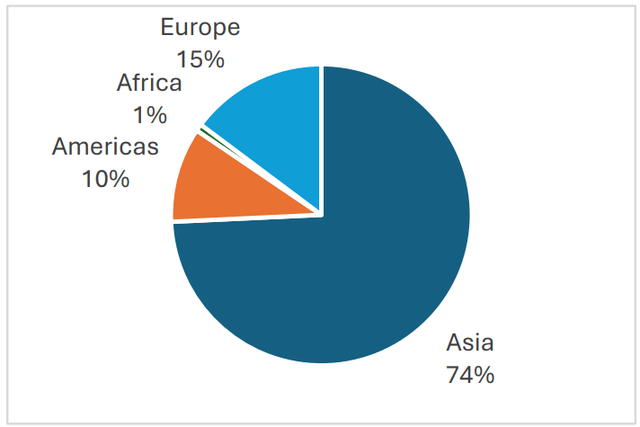
World Copper Council
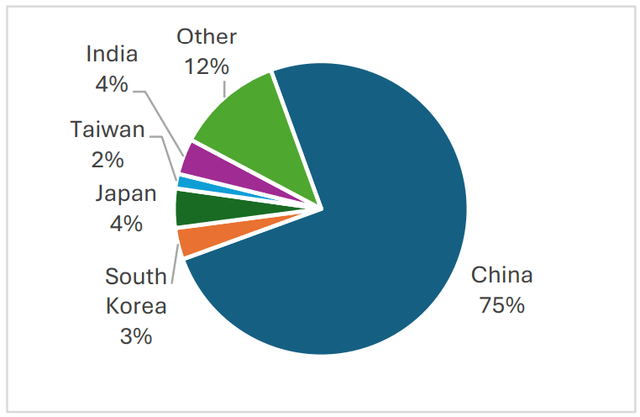
Of this 74% share of global copper consumption, China accounts for 75%:
World Copper Council
Thus, the biggest risk to investors in copper is not so much an economic slowdown in the United States but an economic slowdown in China. Investors in COPX should probably keep a watchful eye on the economic situation in China as part of their due diligence before buying shares of this fund or while owning shares of this fund.
Expenses
The Global X Copper Miners ETF has an expense ratio of 0.65%. Here is how that compares to some of the other exchange-traded index funds that also invest in copper miners:
|
Fund Name |
Expense Ratio |
|
Global X Copper Miners ETF |
0.65% |
|
Sprott Copper Miners ETF |
0.65% |
|
Themes Copper Miners ETF |
0.35% |
|
iShares Copper and Metals Mining ETF |
0.47% |
(all figures from the websites of each of the respective funds)
COPX does have the highest expense ratio of any of the four funds, tied with the Sprott Copper Miners ETF.
Conclusion
In conclusion, the Global X Copper Miners ETF is an exchange-traded index fund that aims to track the price and yield performance of the Solactive Global Copper Miners Total Return Index. This fund’s share price has a fairly high correlation to the price of copper, which is influenced heavily by manufacturing and commercial activity in the broader economy. In particular, conditions in the Chinese economy may have a fairly significant impact on the performance of this fund due to the fact that China consumes a substantial proportion of global copper output. This particular fund does not include exposure to any Chinese companies, except for a few that trade on the exchange in Hong Kong, nor does it hold physical copper as one of its positions. Nevertheless, taking a long position in this fund could be appropriate for any investor who wants to profit from an increase in the price of copper.
This article answers these three main questions about COPX:
- How correlated is COPX to the price of copper?
- Is COPX impacted by global economic cycles?
- How has COPX performed compared to the overall market?
Editor’s Note: This article is intended to provide a general overview of the ETF for educational purposes only and, unlike other articles on Seeking Alpha, does not offer an investment opinion about the ETF.
Read the full article here
 Shareholder/Analyst Call Prepared Remarks Transcript")


")
")
")
")